
Introduction
In everyday life, attention is often captured by things that stand out: bright colours, sudden changes, or irrelevant objects. Classic theories suggest that such salient distractors should interfere with what we are trying to do. A recent study by Ma and Abrams (2023) shows something more subtle: When people expect a distractor and learn to ignore it, the distractor can be actively suppressed.
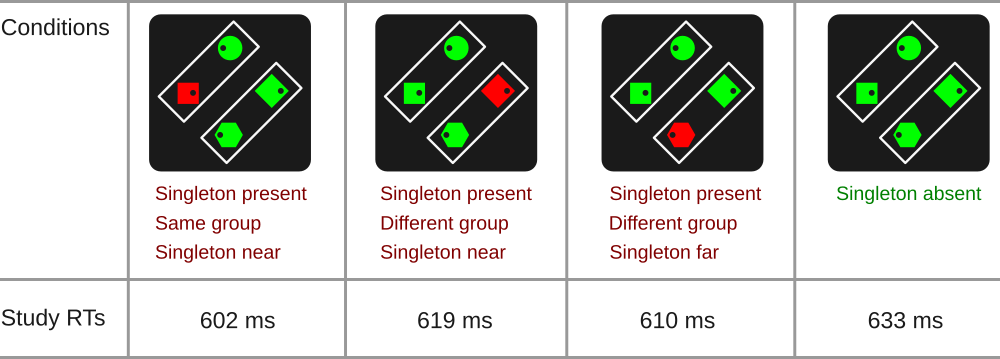
This demo is based on a study by Ma and Abrams (2023) on visual distraction and distractor suppression. In their task, participants search for a specific shape (for example, a circle) and then report whether a small dot inside that shape is on the left or the right. On many trials, one irrelevant shape appears in a different colour. Participants are told that this odd-coloured item is never the target and should be ignored.
A key idea in this study is perceptual grouping. The display contains two frames, which visually group the items into pairs. The research question is whether suppressing a known distractor affects attention only at the distractor’s location or whether it also changes processing of other items that compete for attention.
Surprisingly, the authors found that when the distractor is effectively suppressed, responses can be faster for targets that appear in the same perceptual group as the distractor than for targets that are equally close but in a different group.
Advertisement
Please note that the ad below is to support the PsyToolit platform. Clicking it helps us.
Above is an add. The rest below is ad free. Thank you for watching this.
About this implementation
This demo lets you experience how attention can be shaped not only by what stands out, but also by how the visual scene is organised into groups.
This is a close implementation of Ma and Abram’s Experiment 1a. They used arrow keys, whereas PsyToolkit uses A and L, because the arrow keys are not always easily accessible (e.g., on laptops).
Run the demo
Data output file
| In PsyToolkit, the data output file is simply a textfile. The save line of the PsyToolkit experiment script determines what is being saved in the data output file. Typically, for each experimental trial, you would have exactly one line in your text file, and each number/word on that line gives you the information you need for your data analysis, such as the condition, response speed, and whether an error was made. |
Meaning of the columns in the output datafile. You need this information for your data analysis.
| Colum | Meaning |
|---|---|
1 |
name of block |
2 |
reaction time |
3 |
status (1=correct, 2=wrong key, 3=time out) |
4 |
singleton (one has different color) or no singleton (all same color) |
5 |
singleton in same or different group. Or none if there is no singleton |
6 |
"left" or "right" response needed |
7 |
in case of singleton in different group, this can be far or close. In case of singleton in same group, it is always close |
8 |
1 = left response, 2 = right response (same as 6 but as number) |
9 |
0 = singleton absent, 1 = singleton present |
10 |
location of target (1 = left, 2 = top, 3 = right, 4 = bottom) |
11 |
location of singleton (0 = no singleton, 1 = left, 2 = top, 3 = right, 4 = bottom) |
12 |
specific stimulus number on position 1 |
13 |
specific stimulus number on position 2 |
14 |
specific stimulus number on position 3 |
15 |
specific stimulus number on position 4 |
Check out the source code
Download
| If you have a PsyToolkit account, you can upload the zipfile directly to your PsyToolkit account. |
If you want to upload the zipfile into your PsyToolkit account, make sure the file is not automatically uncompressed (some browsers, especially Mac Safari, by default uncompress zip files). Read here how to easily deal with this.
Further reading
-
Ma, X. and Abrams, R.A. (2023). Visual Distraction’s “Silver Lining”: Distractor Suppression Boosts Attention to Competing Stimuli. Psychological Science, 34(12), 1336-1349. https://doi.org/10.1177/09567976231201853. Link to publisher
-
Supplmentary material for this paper via Open Science Framework