
History of the ANT
The Attention Network Test, usually called the ANT, was introduced by Jin Fan, Bruce McCandliss, Tobias Sommer, Amir Raz, and Michael Posner (2002). The famous Michael Posner describes how this test is also promising for studying ADHD (Posner, 2008). The ANT is suitable for children.
| The first ANT article (2002) is quite popular with thousands of citations. |
The ANT was developed to measure three components of attention within a single short task:
-
alerting,
-
orienting,
-
and executive control.
The ANT combines ideas from Posner’s cued attention paradigm and the Eriksen flanker task. The aim of ANT was to create a simple behavioural test that could be used with adults, children, patients, and even in neuroimaging work.
Advertisement
Please note that the ad below is to support the PsyToolit platform. Clicking it helps us.
Above is an add. The rest below is ad free. Thank you for watching this.
Task description
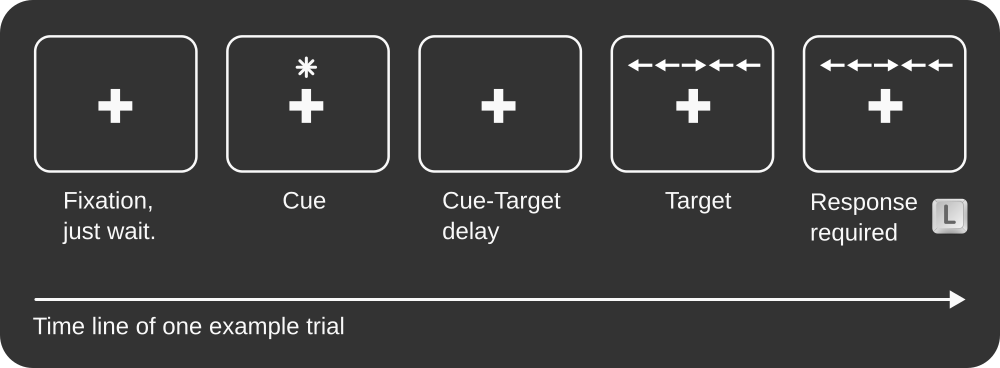
Instruction: In each trial, participants see a fixation point followed by a cue (although sometimes there is no cue). After the cue, 5 arrows are shown. Participants must respond with a left/right key to the direction of the key. The original paper does not specify which keys, in this version we use A (left) and L (right).
There is a practice block with 24 trials. In this block, participants get feedback about their mistakes so they can learn to the task correctly. In the following three blocks of 96 trials each (almost 7 minutes each), there is no feedback on mistakes.
The total time including instructions will be 25 minutes.
Overall, the task is arguably quite long, especially for use in a battery.
Timing of trials
Each trial lasts exactly 4 seconds.
In each trial, the following sequence is shown:
-
Fixation point with random timing between 400 and 1600 msec. This duraction is called D1. The fixation point remains visible throughout trial.
-
Cue (although sometimes there is no cue). 100 msec
-
Cue-Target interval: 400 msec
-
Onset of target. People need to respond within 1700 msec. The reaction time (RT) is used to calculate next point.
-
The response to next trial interval. This is is calculated as follows: 3500 - RT - D1.
Participant instructions and feedback
There was no description of the instruction. We assume that people were informed about all things that could be shown.
About this implementation
The task is a full replication of the original study by Fan et al.( 2002).
Run the demo of the three minute version
Data output file
| In PsyToolkit, the data output file is simply a textfile. The save line of the PsyToolkit experiment script determines what is being saved in the data output file. Typically, for each experimental trial, you would have exactly one line in your text file, and each number/word on that line gives you the information you need for your data analysis, such as the condition, response speed, and whether an error was made. |
Meaning of the columns in the output datafile. You need this information for your data analysis.
| Colum | Meaning |
|---|---|
1 |
Name of block (training, real1, real2, real3) |
2 |
type of cue: no_cue, center, double, spatial |
3 |
target stimulus: neutral, congruent, incongruent |
4 |
center arrow pointing left or right |
5 |
whether target appeared up or down |
6 |
reaction time |
7 |
status: 1=correct, 2=wrong key, 3=time out |
Check out the source code
Download
| If you have a PsyToolkit account, you can upload the zipfile directly to your PsyToolkit account. |
If you want to upload the zipfile into your PsyToolkit account, make sure the file is not automatically uncompressed (some browsers, especially Mac Safari, by default uncompress zip files). Read here how to easily deal with this.
Further reading
-
Fan, J., McCandliss, B. D., Sommer, T., Raz, A., & Posner, M. I. (2002). Testing the efficiency and independence of attentional networks. Journal of cognitive neuroscience, 14(3), 340-347.
-
Posner, M.I. (2008), Measuring Alertness. Annals of the New York Academy of Sciences, 1129: 193-199. https://doi.org/10.1196/annals.1417.011