
Most psychological studies on PsyToolkit are either 1) questionnaires or 2) cognitive experiments. Sometimes, you might want something in between.
First, let’s quickly review the differences between PsyToolkit experiments and PsyToolkit questionnaires:
For most studies, it is clear that you either want to do a questionnaire or a reaction-time (RT) experiment. Or you want to embed an experiment in a survey, such as the Stroop task in a questionnaire in case you want to collect data online.
Likert scales typically are part of questionnaires. This because you typically are not that much interested in the time it takes people respond.
There are some cases where people would like to have a Likert scale in a reaction-time experiment.
The simplest example of this situation:
-
The researcher wants participants to rate stimuli
-
The researcher wants to show the stimuli for a very specific time (e.g., 3 seconds)
-
The researcher wants to know the exact time of the response
There are researchers/students who have these requirments, and this lesson explains exactly how to set up an experiment that can do exactly this.
But before you start, why don’t you have a look at the end product first, so that you know exactly what this is about.
| Run demo of experiment with rating scale. Click here to start. |
|
This lesson expects that you alread know how to set up a survey and a RT experiment in PsyToolkit. This is a relatively advanced topic. This lesson will teach you how to use Psytoolkit to do the following:
|
Step 1. The idea of the experiment
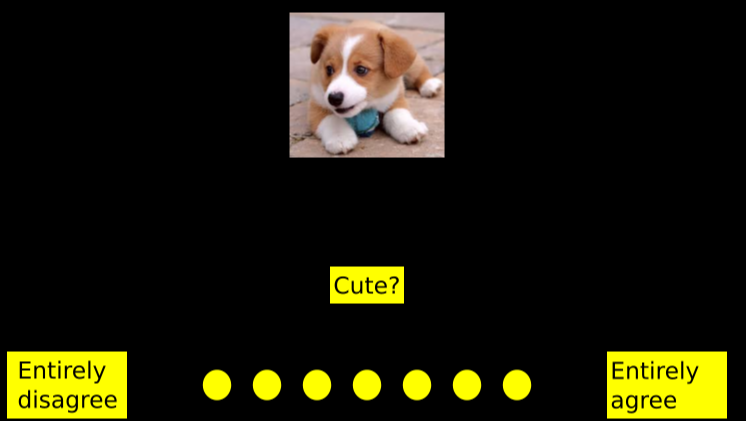
In this experiment, you will be presented pictures of dogs. We want the participant to rate the cuteness of the dogs on a Likert scale. The Likert scale is presented as a series of yellow circles between the words "Entirely disagree" and "Entirely agree". The participant needs to click one of the circles. When done, a green cross will appear and the next trial will follow.
Step 2. Create the stimuli using Inkscape and Google Images
-
Get some pictures of dogs from Google Images, and make sure their size is not too large
-
Create an empty button of the rating scale
-
A crossed button of the rating scale
-
Various text stimuli
-
Instructional stimulus
-
A thank you message when they are done.
Step 3. Setup the experiment
You need to setup a new experiment:
-
Choose "create experiment" from the menu on the left and call it "rate".
-
Then copy and paste the source code you see below under step 4.
-
Upload the following stimuli (explained below)
filename |
explanation |
dog1.png |
|
picture of a dog |
dog2.png |
picture of a dog |
dog3.png |
picture of a dog |
dog4.png |
picture of a dog |
dog5.png |
picture of a dog |
dog6.png |
picture of a dog |
empty.png |
a small yellow circle |
crossed.png |
a small yellow circle with a green cross in it |
agree.png |
the word "agree" as bitmap |
disagree.png |
the word "disagree" as bitmpa |
fixpoint.png |
a fixation point |
cute.png |
A couple of important notes about bitmaps:
-
Each bitmap is of the PNG format. This is the default format in PsyToolkit. In the bitmaps section (see below) you only need to specify the part without the extension ".png"
-
Some bitmaps are words. You can directly create text stimuli in PsyToolkit, but when you create bitmaps (using Inkscape), you have more control over the exact font, shape, and so on.
-
You can download the whole source package including these files below.
| You can download the experiment files below and then upload in your PsyToolkit account (create new experiment and choose Method 2. |
Step 4. Explanation of the code
First, we just list the whole code, and then it will be explained step by step. Don’t be afraid, everything will be explained!
options
  mouse on

bitmaps
  dog1
  dog2
  dog3
  dog4
  dog5
  dog6
  crossed
  empty
  agree
  disagree
  fixpoint
  cute

table dogs
  dog1 "1 cute"
  dog2 "2 cute"
  dog3 "3 cute"
  dog4 "4 aggressive"
  dog5 "5 aggressive"
  dog6 "6 cute"

task rating
  table dogs
  show bitmap fixpoint 0 -100     #1
  delay 500
  clear 1
  draw off
    show bitmap @1 0 -100         #2 bitmap of dog, taken from table (from random table line)
    show bitmap cute 0 100        #3 bitmap with question "Cute?"
    show bitmap disagree -300 200 #4
    show bitmap agree  300 200    #5
    show bitmap empty -150 200    #6 emtpy circles that can be clicked
    show bitmap empty -100 200    #7
    show bitmap empty  -50 200    #8
    show bitmap empty    0 200    #9
    show bitmap empty   50 200    #10
    show bitmap empty  100 200    #11
    show bitmap empty  150 200    #12
  draw on
  readmouse l 1 60000 range 6 12 # wait for left mouse click on rect 1-4 for 10sec
  set $b bitmap-under-mouse MOUSE_X MOUSE_Y # which bitmap was clicked?
  set $score expression $b - 5 # determine scale score
  ## now draw filled stimulus on the selected bitmap
  set $p expression ( $score - 1 ) * 50 - 150 # determine X position of clicked bitmap
  show bitmap crossed $p 200
  delay 300
  clear screen
  delay 300
  save $score RT @2

block test
  tasklist
    rating 6 all_before_repeat
  end
Below, the different sections are explained one by one:
1. The options
Every PsyToolkit can have special options. One of them is the option "mouse on". This option leaves the mouse cursor visible all the time. In most other experiments, the mouse is not used, and therefore hidden, so that it does not distract.
options
  mouse on
2. The stimuli
The bitmaps section describes the various bitmaps in use.
dog1 to dog6 |
the dog pictures. |
crossed |
A green cross that will be shown in the empty yellow circles |
empty |
A yellow circle |
agree |
The word "Entirely agree", right of the scale made from yellow circles |
disagree |
The word "Entriely disagree", left of the scale made from yellow circles |
fixpoint |
A fixation point |
cute |
The word "cute?" |
| The bitmaps section makes sure that all the stimuli files are being "read" into the computer’s memory for use during the experiment |
| When using .png files, you can just specify the first part of the filename without the extension ".png" |
3. The table "dogs"
The table describes the 6 different conditions of this experiment. Each condition is just a different dog. There are two columns in this table (refered to @1 and @2 in the "task" description, which we will describe in the next point).
The first column tells the computer which dog picture to show. The second column holds text information (in quotes) about the condition that we will later write in the output data file (in the save line). The information in quotes ultimately aims to make the output data file easier to read for us.
table dogs
  dog1 "1 cute"
  dog2 "2 cute"
  dog3 "3 cute"
  dog4 "4 aggressive"
  dog5 "5 aggressive"
dog6 "6 cute"| In this experiment, there are no right or wrong answers. Whether you find something cute is, of course, just a matter of taste. Therefore, the table does not hold informantion about what the correct response (as would the case in most other experiments). |
4. The task "rating"
This is the most complex part of the code.
First, we tell the computer that we are now going to describe exactly what happens in one trial of the task "rating":
task ratingSecond, we tell the computer that for this task, we use the table "dogs". Each time that the computer runs a trial of the task "rating", it will randomly select one line from this table. Because the table has 6 lines, there is a 1 in 6 chance that each dog from the 6 dogs is being shown:
table dogsThird, we show a nice fixation point. This is pretty common in cognitive experiments (it encourages the participant to look at a specific location of the screen).
Note that everything after a "#" is a comment. The #1 just helps the person programming the experiment remember that the first stimulus is the fix point. It is followed by a delay period of 500 ms (half a second), and then it is being "cleared" from the screen. In other words, "clear 1" erases the first stimulus from the screen.
| Instead of "clear 1", you could write "clear -1", which erases the last presented stimulus, "clear -2" would erase the second larst presented stimulus, etc. |
  show bitmap fixpoint 0 -100     #1
  delay 500
  clear 1
Fourth, we show the Likert scale. Because the 11 bitmaps are presented simultaneously, we put the "show bitmap" statements between "draw off" and "draw on". When you write "draw off", the computer waits with actually drawing stimuli, and when you write "draw on", it draws all the stimuli since the last "draw off" at once.
Note that position "0 0" is the screen center.
  draw off
    show bitmap @1 0 -100         #2 bitmap of dog, taken from table (from random table line)
    show bitmap cute 0 100        #3 bitmap with question "Cute?"
    show bitmap disagree -300 200 #4
    show bitmap agree  300 200    #5
    show bitmap empty -150 200    #6 emtpy circles that can be clicked
    show bitmap empty -100 200    #7
    show bitmap empty  -50 200    #8
    show bitmap empty    0 200    #9
    show bitmap empty   50 200    #10
    show bitmap empty  100 200    #11
    show bitmap empty  150 200    #12
  draw on
Fifth, give the participant 60 seconds (i.e., 60,000 ms) to click one of the 7 yellow circles with the left mouse button. Here, the "readmouse" statement tells the computer to wait until the left mouse button is clicked (i.e., "l"). The "range 6 12" makes sure that only a click on those 7 bitmaps will be registered. The "1" in the line below is somewhat redundant (you need to use it in the current version, but it does not code anything relevant).
readmouse l 1 60000 range 6 12Sixth, now figure out what the score of the participant on this Likert scale is. We can ask PsyToolkit what the number of the bitmap is that was clicked, that is, where the X and Y position of the mouse currently are. Because the empty yellow circles correspond to the 6th to 12th bitmap being shown, the value of $b will be a value between 6 and 12. Of course, we really want a value between 1 and 7, so we just subtract 5 with the "expression" line.
After the following lines, $score will hold a number between 1 and 7.
  set $b bitmap-under-mouse MOUSE_X MOUSE_Y # which bitmap was clicked?
  set $score expression $b - 5 # determine scale score
Seventh, now we want to draw a green cross on top of the yellow circle that was clicked by the participant. We use the expression statement to find out the exact position in pixels. The first yellow circle was being shown at location -150. Thus, if the $score is 1, then "$score - 1" equals 0, which makes that $p will contain the value -150. You can figure out how this works for the other 6 yellow circles.
  ## now draw filled stimulus on the selected bitmap
  set $p expression ( $score - 1 ) * 50 - 150 # determine X position of clicked bitmap
  show bitmap crossed $p 200
Eight, now we wait 300 ms, erase everything from the screen (it will be black again), and then wait another 300 ms. You want such delays at the end of a trial, otherwise things runs just too fast for the participants.
  delay 300
  clear screen
  delay 300
Nineth, the following final line of the task description makes sure that the most important information of the trial is kept for the researcher. It saves the $score, RT, and the chosen second column of the table to the output datafile:
save $score RT @25. The block "test"
We have one block of 10 trials. Every trial, the task "rating" is carried out. It is made sure that the selection of a condition (see the table) is never repeated before all conditions have been chosen once.
block test
  tasklist
    rating 6 all_before_repeat
  end
Step 5. Understanding the data file
If you have the code in your own PsyToolkit account, and when you run the experiment, you see the data output when it finishes. The datafile is created because of the line save $score RT @2 in each trial. For each trial, we have:
-
the score on the Likert scale (from the variable $score")
-
the response time in milliseconds
-
the text description from the table which contains a number (indicating which dog picture was shown) and whether it was a cute or agressive dog
And that is it
Hopefully, this helps you to set up your own study. If you still have questions, just let me know via email.