
| This is the complete description of an online psychological research project with video tutorials. This survey includes an online experiment. If you are not interested in how to program an online experiment, and if you are only wanting to do a questionnaire, you might go to the lesson about just that. This lesson is really for understanding of cognitive psychological experiments, and how to embed them in online studies. |
This can be useful for any researcher, including psychology students doing their research project.
|
This lesson will teach you how to use Psytoolkit to do the following:
|
Step 1. Think about your experiment and create stimuli
Before you start doing anything, you just need to think about your task and use paper and pencil to draw out what you want it all to look like. Here are the things to think about in general.
-
What exactly do I want to measure, and can it be implemented in PsyToolkit (there are limitations with any type of software)
-
How long should the study last?
-
How many trials
-
What should the stimuli look like (not you can have sounds too, but they are not used in this example project)
Step 2. Draw the stimuli using Inkscape
In this experiment, we are going to replicate the Simon effect. I will need the following stimuli:
-
A left pointing arrow
-
A right pointing arrow
-
A fixation cross
-
Instructions at the start of the experiment
-
Error message if people make mistake
-
Information to tell people they are going to train (block 1)
-
Information to tell people they are going to do real data collection (block 2)
-
A thank you message when they are done.
We know the default resolution of experiments is 800 by 600 pixels, so stimuli need to be made to fit in that.
-
You need to learn a bit of Inkscape
-
Open Inkscape
-
Draw the stimuli, export the stimuli, save the inkscape (SVG) file
| Watch the video (15 minutes) on how to draw the stimuli, 15 mins (fullscreen recommended). This is by far the longest video here, but really gets you going with one of the most important parts of designing an experiment, namely creating good stimuli! |
| The sound is somewhat low on the first few videos, so you need to increase your volume! |
| In the video, the stimuli are saved as PNG files. But PsyToolkit can work with any type of bitmap, like JPEG, BMP, GIF, etc. PNG is chosen here because it is what Inkscape exports. Check the documentation for details. |
Step 3. Create new experiment
-
Login and create new experiment
-
Call it "simon"
-
Start coding in the top white box
-
Use the scripting tab for help
| Watch video (2 mins) how to create a new experiment and start the code: |
Step 4. Code the experiment
Before you start here, it is important to understand the structure of an experiment coded in the PsyToolkit scripting language. This is explained in the online documentation. Here is a short summary:
|
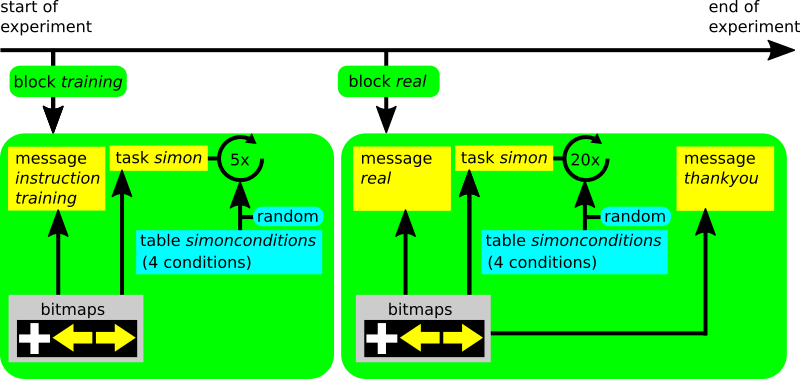
| The description of these sections is not exactly the order of events in the experiment. The experiment really starts with the first block, even though that is put half way in the code. The flow diagram of the logic of the script and how it acts out is shown in the flow diagram below: |
The code of the experiment is below, just for reference. Each line of code is further described in the videos below. But is nice to have a quick look at it so you know what we are talking about.
bitmaps
  leftarrow
  rightarrow
  training
  real
  instruction
  thankyou
  errorfeedback
  fixpoint

table simonconditions
  "leftpos leftA com"   leftarrow  -200 1
  "rightpos rightA com" rightarrow  200 2
  "leftpos rightA inc"  rightarrow -200 2
  "rightpos leftA inc"  leftarrow   200 1

task simon
  table simonconditions
  keys a l
  show bitmap fixpoint
  delay 200
  clear 1
  show bitmap @2 @3 0
  readkey @4 2000
  clear 2
  if STATUS != CORRECT
    show bitmap errorfeedback
    delay 500
    clear -1
  fi
  delay 500
  save @1 STATUS RT BLOCKNAME

block training
  message instruction
  message training
  tasklist
    simon 5
  end

block real
  message real
  tasklist
    simon 20
  end
  message thankyou
Stimuli definition and upload
-
first tell the computer about the stimuli and upload them
| Watch the video (3 mins) how you tell the computer which bitmap |
| In order to draw stimuli on the screen, you need to provide an X and a Y coordinate. The XY coordinates 0 0 refer to the screen center. The XY coordinates -200 0 refer to a position halfway left of the screen center, etc. |
Defining conditions
-
create a PsyToolkit table which holds info about the 4 conditions:
-
Stimulus presented left + Left pointing arrow = compatible
-
Stimulus presented right + Right pointing arrow = compatible
-
Stimulus presented left + right pointing arrow = incompatible
-
Stimulus presented right + left pointing arrow = incompatible
-
| Watch the video (5 mins) on how to program the 4 conditions. |
Describing events
-
Each event of a trial is described in the task section
| Watch video (7 minutes) of how to describe the task with trial events |
Blocks
Now we are going to enter the block information
-
Welcome message
-
Training block of 5 trials
-
Real data block of 20 trials
-
Thank you message
| Watch video (4 minutes) of how to setup blocks of trials and general welcome/instruction/thank you messages. |
Step 5. Compile and run
-
Now that your code is typed and your stimuli are uploaded, try to compile
-
Most likely, the compiler said that there was a mistake, simply because it is very easy to make a type somewhere
-
Do not worry, the computer will help you to find where the error occurred.
| Watch video (5 minutes) of how compile and run your experiment in your browser, and how to save the data automatically. |
| Coding is often a process of trial and error. The error feedback in the yellow box should give you a hint on what to improve. Can you figure out what you did wrong? |
-
Once the compiling does not return error messages, you can try out your experiment by clicking the "run" button.
| At the end of the experiment, the computer can show you your data and even save it into your account. Make sure you choose this option, because we need the data for the next step. |
Step 6. Analyze your test file
-
In the experiment, browse down to "analyze", and select this
-
You can select the datafile you have just made. This is now the file you work on (you can have multiple files)
-
In the boxes, you can enter the most important things for the data analysis.
-
Each line of your data file is a trial in the task.
-
Select which column is the RT, the error, the block
-
Also select that you want to exclude training data from your data analysis
-
Also select that you want to exclude trials immediately following a mistake
-
Click "analyze" and look at your average responses.
| In principle, if you are running a lab experiment, you can just run your experiment and save the collected datafiles here. If you do so, make sure you keep a log book of your study. |
| In cognitive psychology, we typically collect data from a number of participants. For example, in the Simon task, you might be fine with 10 to 20 participants. Then in the group analysis, we compare the average scores from each participants in an group analysis, which will be explained further below. |
| Watch the video (5 minutes) on how to analyze your test data file. |
| At this point, you have learned how to code an experiment and how to do a basic analysis. In the remainder of this project description, we are going to embed the Simon experiment in an online questionnaire/survey and collect online data. After that, we will download and analyze the data. |
Step 7. Setup online project
Setup an online survey
-
Now that your experiment works, you are ready to set up an online study in which you will embed the experiment.
-
Look at the functions on the left, and select "Create a survey"
-
Call it "simon_survey"
| Watch the video (3 minutes) on how to setup the first parts of an online study. |
Start with questions and test survey
-
In the top box is the code of the survey.
-
Each question item consists of a few lines, and there is a lot of documentation
-
Think about the things you want to know from your participants
-
At the very least, you want to know the age
-
You also need to setup the introduction/welcome screen
-
You need to make the study "online"
-
You need to compile and test the survey
| The "save" button of the survey code will turn yellow when the code has not been saved. You don’t want to loose your code! |
| Watch the video (5 minutes) on how start entering questions of the online questionnaire in which the experiment will be embedded. |
Finish survey
-
We add a couple of questions from the survey-library
-
Embed the experiment
-
Compile and test run
-
Move to real data collection mode
-
Ready to ask your participants!
| Watch the video (5 minutes) to see how the experiment is embedded in the online questionnaire. |
Like the code for the experiment, you can see the actual code of the survey, just for reference. Each line of code is further described in the videos.
l: age
t: textline
q: How old are you?
- {min=18,max=100} Enter your age

scale: side
- {score=-100} Always left
- {score=-50} Usually left
- {score=0} Both equally
- {score=50} Usually right
- {score=100} Always right

l: questions
t: scale side
o: width 20%
q: Please indicate your preferences in the use of hands in the following activities or objects
- Writing
- Throwing
- Toothbrush
- Spoon

l: score
t: set
- mean $questions

l: simonexperiment
t: experiment
- simon
Step 8. Analyze data
Once you are finished collecting data, you want to analyze your data.
Make sure your experiment analysis is set
-
The system needs to know which block of data you want to include (e.g., you are likely not interested in the training block), etc.
| Watch the video (1.5 minute) on how to get ready for data analysis of all participants in your study. |
Download your data
Once your participants have done the experiment, you are ready to get your data from the server.
| Watch the video (3 minutes) to see how to download data, and what the files in the data.zip files are |
| There is an option to include data files in an SPSS compatible format, making is very easy to get your data into SPSS. |
| Watch the video (3 minutes) on understanding the download process and the meaning of the individual files in the download. |
Open your data file in SPSS
In this section, we are going to analyze the data with SPSS. It is assumed that you have installed SPSS, which is popular in psychology teaching. Of course, the data are in a generic format and can be analyzed with any stats program.
| Watch the video (8 minutes) on how to import and analyze your PsyToolkit dataset in SPSS. |
And that is it
Hopefully, this helps you to set up your own study. If you still have questions, just let me know via email.