
The following lesson is about cueing.
-
Learn about stimuli and responses
-
Learn what a cue is
-
Learn how to analyse the data with R
-
Create your own cueing study
-
RT Response Time
-
SOA Stimulus Onset Asynchrony
In cognitive experiments, participants (or animals) respond to stimuli. Stimuli are typically presented on a computer monitor (as explained in the other lessons). Responses are typically recorded using a dedicated keyboard, but regular computer keyboards and the mouse do the job as well (although the timing might not be as accurate as researchers would like). Responses can also be eye-movements, foot movements, or any other bodily response. In the current lesson, we will study left and right hand finger responses.
In the current lesson, we are going to study how long it takes you to respond to a left or right positioned stimulus on the screen with the A or L key of your computer keyboard. Typical response times in this situation are between 250 and 500 ms (People differ slightly. Your concentration and age are important factors, but they are not considered in this specific demonstration).
The current experiment has an additional feature to the target stimuli, namely cues.
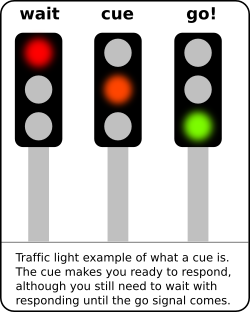
In the following experiment, you will see a left or a right go signal. You should press the A or L key in response as instructed on the screen. But shortly before, you see a little cross at the location where the go signal will come.
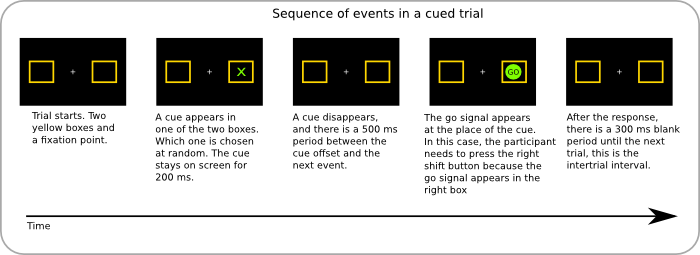
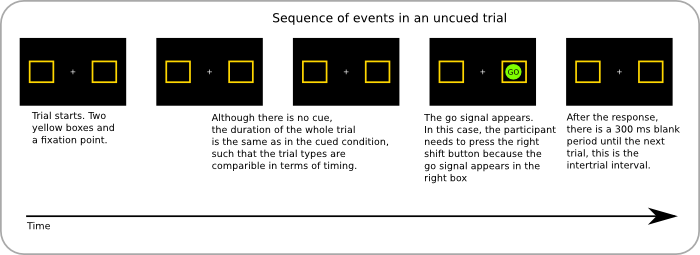
Below you see two pictures that schematically explain what happens in trials of the experiment
In the image below, you see what happens in an uncued trial.
Do it yourself
The best way to understand this phenomenon is to run an example. In the following example, you will see:
-
A fixation plus. Try to look at this during the experiment.
-
You will see a go signal will come left or right, press the corresponding key (A or L)
-
On half the trials, you see a cue before the go-signal appears. You will experience that you can respond much quicker on those trials.
Valid and invalid cues
In the demo, the cue is always followed by a target stimulus. This means, the cue is always a valid cue. Frequently, experimenters use both valid and invalid cues. Invalid cues are those that show up at the other location than the target; they mislead you. If you want to learn more about this and see this in action, please check the lesson about Inhibition Of Return.
Analysing your own data
The following is only for advanced users; it is not necessary to understand the basic concept of cueing.
For the following, you need the following files.
In order to do this, you need to access your datafile. You need to download the files and save to your computer. In the new folder, click the Java file. It will be the same as the demo, but now a data file will be created. Running the Java file from your local hard disk will automatically create a file that has the date and time in its file name. Now locate that file before you continue.
Next, you need to use the R file that comes with the downloaded files. It is called, analyze.r. Before you run this file in R, you need to specify which experimental data file it should read in. If you have run the experiment only once, there should only be one file. If you ran it more than once, there are more. All you need to do is set the variable datafile to the filename. Make sure you put the filename in quotation marks, because it is a string variable! Then you load the files:
datafile = "example.data"
source("analyze.r")
source("boxplot.r")
Below you see the boxplot of the example data file that comes with the experiment. Box plots are a great way to display data.
Ideas for homework
-
What is your average response time in cued and uncued trials?
-
If you were writing the results section for a scientific journal in APA format, how would you do this. Look here for some help.
-
Did you perform differently in left and right button press conditions? If so, why do you think this is?
-
What are the shortcomings of the experiment? Can you change the code to deal with those?
-
Create a new PsyToolkit experiment with stimuli that look like real traffic light. Compare the response times with the real starting times of people using traffic light in real life.
Reading material
-
Posner, M.I. & Cohen, Y.P.C. (1984). Components of visual orienting. In H. Bouma & D. Bouwhuis (Eds.), Attention and per- formance X: Control of language processes (pp. 531–556). London: Lawrence Erlbaum.
-
Klein, R. M. (2000). Inhibition of return. Trends in Cognitive Sciences, 4, 138-146.
-
Chun, M. M. (2000). Contextual cueing of visual attention. Trends in Cognitive Sciences, 4, 170-178.