
Introduction
It is strongly recommend to first read the lesson about cueing.
The effect of slowing down when responding to previously cued locations is relatively small. It is a slowing down of around 20 ms compared to detecting relevant stimuli at positions that were not previously attended.
-
IOR Inhibition Of Return
-
RT Response Time
-
SOA Stimulus Onset Assynchrony
-
CTOA Cue Target Onset Assynchrony
Do it yourself
The best way to understand this phenomenon is to run an example. In the following example, you will see:
-
A fixation plus. Try to look at this during the experiment.
-
Two boxes, left and right of the fixation plus.
In this experiment, you will see the following happening.
-
You will see a cue in of the two boxes. This is an irrelevant distraction that causes IOR.
-
You will see a go-signal appear left or right. When you see this, press the corresponding key of your keyboard (A or L). Your RT will be measured.
There are various things that can be done differently in this experiment. First of all, the irrelevant distraction left or right can be implemented differently. Here it was a small x, but it can be anything, as long as you direct your attention there. Second, the relevant stimulus, the target can be anything, as long as you tell the participant how to respond.
The time course
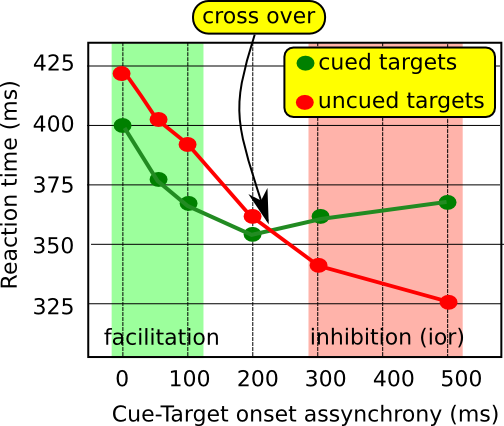
The duration between cue and target is important. And so is the fact that the cue is irrelevant. The figure below is adapted from Figure 1b of Klein (2000) and shows the relationship between IOR and the cue-target duration (SOA = Stimulus Onset Asynchrony). What you see is that when the time between the cue and the target is very short (below 200 ms), people respond more quickly to cued than to uncued targets. But this changes when the SOA becomes longer (from 300 ms onward). The crossover point is where cueing changes from facilitating responses to inhibiting responses. This only happens when there are both valid and invalid cues. If all cues are valid, it does not happen (as was the case in the cueing lesson).
Analyzing your own data
The following is only for advanced use, it is not necessary to understand the basic phenomenon. Analyzing your own data requires some extra skills. For those who would like to analyze the data, please download the zip file with the PsyToolkit experiment files and the R files.
You can analyze the produced data file using the R file analyze1.r
Next, you need to use the R file that comes with the downloaded files. It is called, analyze1.r. Before you run this file in R, you need to specify which experimental data file you want to analyze.
datafile = "example.data"
source("analyze1.r")
source("boxplot1.r")
Group analysis
In cognitive psychology, we are primarily interested in processes that are common to most (if not all) people. The repeated measures design is commonly used to study different conditions in multiple people, whereby each person performs a number of conditions. The "repeated" refers to the fact that each participant performs the experiment in multiple conditions (sometimes, students confuse this; just the fact that you carry out multiple trials does not mean that the design is a "repeated measures design").
Do it yourself
The following example is identical to the first study, except for the variation in the SOA. The example R file shows you how to plot a graph similar to the above one for your own data.
datafile = "example.data"
source("analyze2.r")
source("boxplot2.r")
source("ior-by-soa.r")
Ideas for homework
Simple questions; you will need to read at least the Klein (2000) paper.
-
Who wrote about IOR for the first time? When was this? What was the name of the article?
-
Can you define IOR in your own words without looking at the text?
-
Again, define IOR, but now such that non-experts can easily understand it.
-
What is the minimal time between cue and target for IOR to occur?
-
How large is the average IOR effect in milliseconds?
Advanced questions
-
What are the possible underlying causes for IOR?
-
What is the evolutionary explanation for IOR?
-
Does IOR only occur in humans?
-
How does your data, as analyzed with ior-by-soa.r, compare to Figure 1b of Klein (2000)?
-
IOR is not always observed in this lesson, even under conditions in which the literature reports IOR. Which factors could contribute to this?
Program and analyze
-
Change the experiment to study what the longest time between cue and target is under which you show IOR. Use R or SPSS to analyze the data.
-
Change the experiment to use more than two locations. For example, use four locations (for example: top left, top right, bottom left, bottom right). Use R or SPSS to analyze the data.
-
Design an experiment to test whether the number of locations matters. Implement and test this with at least 8 participants. Use R or SPSS to analyze data using a repeated measures ANOVA.
-
Design an experiment in which the cue probability is no longer 50/50. Use R or SPSS to show how the probability of the cue location changes the time course.
-
Create an experiment in which you vary the distance between the boxes and the screen center. Does it matter?
Reading material
-
Abrams, R. A., & Dobkin, R. S. (1994). The gap effect and inhibition of return: Interactive effects on eye movement latencies. Experimental Brain Research, 98, 483-487.
-
Abrams, R. A., & Dobkin, R. S. (1994). Inhibition of return: Effects of attentional cuing on eye movement latencies. Journal of Experimental Psychology: Human Perception and Performance, 20, 467-477.
-
Posner, M.I. & Cohen, Y.P.C. (1984). Components of visual orienting. In H. Bouma & D. Bouwhuis (Eds.), Attention and per- formance X: Control of language processes (pp. 531–556). London: Lawrence Erlbaum.
-
Pratt, J., & Abrams, R. A. (1999). Inhibition of return in discrimination tasks. Journal of Experimental Psychology: Human Perception and Performance, 25, 229-242.
-
Klein, R. M. (2000). Inhibition of return. Trends in Cognitive Sciences, 4, 138-146.