
Introduction
The Psychological Refractory Period (PRP) is a fascinating and intensively studied phenomenon which goes at least back to the work by Welford (1952) and is strongly associated by the extensive body of work on this topic by famous psychologist Harold Pashler (1994).
The wikipedia link does a good job explaining the phenomenon.
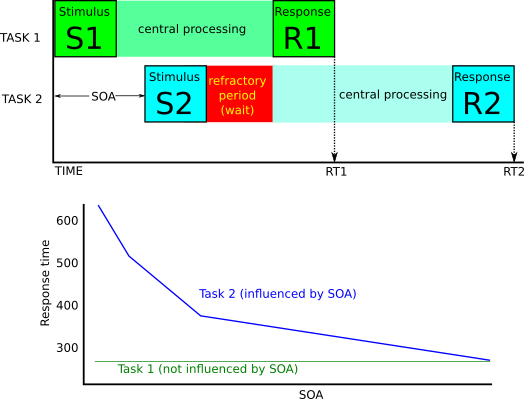
In short, you do two tasks shortly after each other (task 1 and task 2). It turns out that the shorter the time interval between stimulus one and two (the SOA, see figure below, inspired by Pashler’s 1994 paper, p. 222, figure 1), the longer response time in task 2. One of the explanations for this is that the central processing of stimulus 2 has to wait (i.e., the refractory period) until the participant is done processing stimulus 1. The idea is that people can only handle the central processing of one task at the time. This is the central bottleneck.
The PRP paradigm has been used to distinguish between a single bottleneck model (e.g., McCann & Johnston, 1992) of information processing and a resource model. A good critical approach against the bottleneck model is the paper by Navon & Miller (2002).
All sort of smart methods have been used to prove that there is a single central bottleneck, although the debate continues until this day. One of the interesting manipulations is the difficulty level of task 1 (as is provided in the implementation here).
This topic is related to multitasking. As explained in the experiment library entry under multitasking, there are different ways to measure multitasking, and this is one of them. In this case, the multitasking really focuses on the simultaneous processing of information.
Some researchers have studied the effects of practice on PRP and whether or not the effect can be eliminated through practise Van Selst, 1999.
About this implementation
PRP paradigms come in all shapes and forms. Pashler’s 1994 paper gives a good overview of it. The implementation here is inspired by Pashler’s paper, but some of the parameters have been chosen by me.
The difficulty of task 1 is manipulated by having sounds that are easy to classify as low or high or difficult to classify as low and high.
| In this example, you need speakers or headphone, because sound stimuli are used. Sounds have been created with the popular completely free-of-cost sound editor audacity. |
| Here is how you can generate your own tones using audacity. From the menu, select "generate". Then select "tone". You can select any waveform. The sounds selected for this experiment are probably not as nice as sine waves. Then you can play the sound, and if happy, from the "file" menu option, select "export audio". I selected the mp3 file format, because this creates very small audio files, which means that the experiment will start up faster. |
Each square wave sound stimulus is 200 ms long, and the following frequencies have been used: 220, 440, 660, 880 Hz.
| Make sure that sounds are audible on all computers. Some lower sine waves might not be audible on some hardware, because they are simply too low for the hardware. For example, on my laptop, I can hear a 220 Hz square wave, but not a 220 Hz sine wave. |
Run the demo
| There are 20 training trials and 100 real trials — hopefully you do not find this too long! The sound discrimination can be considered difficult in the beginning, because you need to be able to call 440 Hz as low and 660 Hz as high. Are you up to it? Anyway, that is the difficulty manipulation of this experiment! |
Data output file
| In PsyToolkit, the data output file is simply a textfile. The save line of the PsyToolkit experiment script determines what is being saved in the data output file. Typically, for each experimental trial, you would have exactly one line in your text file, and each number/word on that line gives you the information you need for your data analysis, such as the condition, response speed, and whether an error was made. |
Meaning of the columns in the output datafile. You need this information for your data analysis.
| Colum | Meaning |
|---|---|
1 |
blocktype (1=training, 2=realdata) |
2 |
s1: tone (lo or hi) |
3 |
s2: color (yellow or blue) |
4 |
task 1 difficulty (easy or difficult) |
5 |
low/high tone as number (1=low, 2=high) |
6 |
yellow/blue as number (1=yellow, 2=blue) |
7 |
soa (75,150,300,600) |
8 |
response time 1 |
9 |
response time 2 |
10 |
status of response 1 (1=correct, 2=wrong, 3=timeout) |
11 |
status of response 2 (1=correct, 2=wrong, 3=timeout) |
Check out the source code
Download
| If you have a PsyToolkit account, you can upload the zipfile directly to your PsyToolkit account. |
If you want to upload the zipfile into your PsyToolkit account, make sure the file is not automatically uncompressed (some browsers, especially Mac Safari, by default uncompress zip files). Read here how to easily deal with this.
Further reading
-
Pashler, H. (1994). Dual-task interference in simple tasks: Data and theory. Psychological Bulletin, 116, 220-244.
-
McCann, R. S. & Johnston, J. C. (1992). Locus of the single-chanel botleneck in dual-task interference. Journal of experimental psychology-human perception and performance, 18, 471-484.
-
Welford, A. T. (1952). The "psychological refractory period" and the timing of high speed performance - A review and a theory. British Journal of Psychology, 43, 2-19.
-
Navon, D. & Miller, J. (2002). Queuing or sharing? A critical evaluation of the single-botleneck notion. Cognitive psychology, 44, 193-251.
-
Pashler, H. (1989). Dissociation’s and dependencies between sped and accuracy - evidence for a 2-component theory of divided attention in simple tasks. Cognitive psychology, 21, 469-514.
-
Van Selst, M., S., Ruthruff, E., & Johnston, J. C. (1999). Can practice eliminate the psychological refractory period effect? Journal of experimental psychology-human perception and performance, 25, 1268-1283.